 |
|
You are here: Ultra Guide>Main Web>DoCoolStuff>FlowchartsWithGraphviz (19 Mar 2020, NicoleRadziwill)Edit AttachTags
Flowcharts with Graphviz
You can draw flow charts with Graphviz by specifying, in plain text, the relationships you want to illustrate. This is great for documenting processes and database schemas/ERDs or making ideas more clear. Bottom two examples are from dotguide.If you write this code inside one of the pages or topics you create on this site:
<blockquote><graphviz renderer="dot" type="png">
digraph G { rankdir=LR; Hello[fontcolor="red"]; Hello->World }
</graphviz></blockquote>
It will produce this when the page is loaded:

This code:
<blockquote>
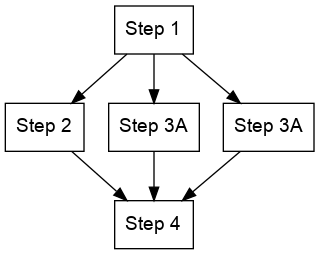
%GRAPHVIZ{
"digraph G {
node [shape=record fontname=Arial];
A [label="Step 1"]
B [label="Step 2"]
C [label="Step 3A"]
D [label="Step 3A"]
E [label="Step 4"]
A -> {B, C, D} -> {E}
}"
renderer="dot"
type="png"
}%
</blockquote>
Produces this:
This code:
<blockquote>
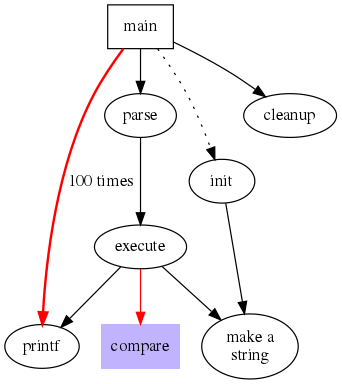
%GRAPHVIZ{
"digraph G {
size="4,4";
main [shape=box]; /* this is a comment */
main -> parse [weight=8];
parse -> execute;
main -> init [style=dotted];
main -> cleanup;
execute -> { make_string; printf}
init -> make_string;
edge [color=red]; // so is this
main -> printf [style=bold,label="100 times"];
make_string [label="make a\nstring"];
node [shape=box,style=filled,color=".7 .3 1.0"];
execute -> compare;
}"
renderer="dot"
type="png"
}%
</blockquote>
Produces this:
Here are:
- https://graphs.grevian.org/example
- https://renenyffenegger.ch/notes/tools/Graphviz/examples/index
- More information about the Graphviz Plugin
Edit | Attach | Print version | History: r6 < r5 < r4 < r3 | Backlinks | View wiki text | Edit wiki text | More topic actions
Topic revision: r6 - 19 Mar 2020, NicoleRadziwill
PUBLIC WEB


- Webs
-
 Automation
- Main
- System
- Testing
© 2020 Ultranauts - 75 Broad Street, 2nd Floor, Suite 206, New York, NY 10004 - info@ultranauts.co